Mining the Data
What happened? We turn to the art market.
As the dizzying effects from the nuk subside and the dust settles, we forage.
The resource in pursuit is data.
Data that helps our readers make sense of what happened. Data that helps them avoid repeating a mistake or failing to heed the warning signs. Data that is hidden in an untapped mine of undiluted alpha.
And with our keyboards as our pick axes, we marched through the internet with our head down ready to mine it.
We occasionally surfaced to see what the community was thinking, each time we were veered off course.
This veering involved finding a new culprit to blame for the pull back yesterday. And as we realized there was no data to verify the authenticity of the claim, we refocused our efforts to stay in our lane and resume the hunt.
For us the data is calming. It doesn’t lie. There is no conspiracy-like conclusion that needs to be fabricated.
While we still need to manufacture a narrative around the data, there is less speculation. And thus wasting less time discussing irrelevant facts.
So for today’s Espresso, we look to stay in our lane and show you what we have so far.
The Crossover
Now, to start off, I want to address Sam Trabucco’s tweet. He claimed yesterday’s sell off to be similar to the Elon sell off earlier this year.
But in reality, I don’t believe it tells the whole story.
First off, here are funding rates of late… Not too bad.
Here are funding rates from Aril and May…
Quite a bit of difference as the top in the market was met with funding rates of 0.4 or 1.2% daily or more than 400% on an annual basis as seen in the second chart.
So traders were not paying a premium for long exposure.
Sure, the ability for new open interest to impact the price of bitcoin was becoming muted. And thankfully the folks at InTheBlock turned my rough sketch into a more polished end product (whether it was actually because of me or not is unknown!).
The chart below is from InTheBlock and takes OI and divides it by market cap. As the blue line rises, the new positions being opened up do not result in a rise of market cap as much as it did prior.
Note, this logic makes more sense in a bullish market with rising funding rates (which we had for the most part). The red boxes depict rising OI with less impact on price (ignore the green box).
This chart tells us that traders were in fact opening up positions, and the impact on spot prices were becoming muted.
So Sam was sort of right about his tweet.
But what I really wanted to see was the comparison to Coinbase again. This is the real reason I bring up Mr. Trabucco. In May he wrote up a great thread on what happened in the lead up to the major selloff. (Unfortunately cannot find the link nor want to scroll back through his Twitter to find it.)
His main premise was when Coinbase shares began trading, the market began to show signs of exhaustion. And at the time it was running very hot for some time.
Hard to dispute that. But one piece I think that we can look at further is what one of our friends said that runs a fund himself…
In April when the market peaked and Coinbase listed we had a cross-over event. Which is to say an event where crypto crosses the rubicon into the normal world.
We had a similar cross-over event when the Chicago Mercantile Exchange listed bitcoin futures in December 2017. Similar to Coinbase, bitcoin topped out that day.
Fast forward to today…
We saw a massive NFT sale at Sotheby’s auction house. While it wasn’t the first auction held by a traditional house, this one was unique.
Over 100 Bored Apes and some sort of Dog NFT were being sold. The auction started on September 2. And in some ways this didn’t feel like a one-off event like Beeple or a CryptoPunk sale.
It felt more like a new market opened up similar to CME bitcoin futures and COIN.
But what did the data say?
Let’s take a look…
In the build up to the Sotheby’s event the NFT market was euphoric. Just a few days before the auction began over $267 million worth of NFTs were sold. A record.
This amount still market the top for the NFT market.
(Data courtesy of nonfungible.com)
From that day on NFT activity began to sag. And on September 2 the amount of active wallets plunged… This was the same day the auction started.
With NFT sales starting to cool down the overall activity in the market responded.
Since the auction you can see what happened to the price of ether compared to bitcoin in the chart below. It sagged.
Fairly interesting.
The activity in the NFT market coincides with the overall market. And based upon Ethereum’s recent EIP-1559 policy, the token’s price becomes more responsive to its underlying activity. Which can maybe explain part of why ETH/BTC trended down as NFT activity trended down.
But when you pair up the NFT activity with bitcoin, the drop makes more sense.
Remember, with bitcoin we were witnessing the rising OI having a lower impact on price (chart below).
There was no shortage of bearish onchain metrics as seen in our previous write up in Finding Direction.
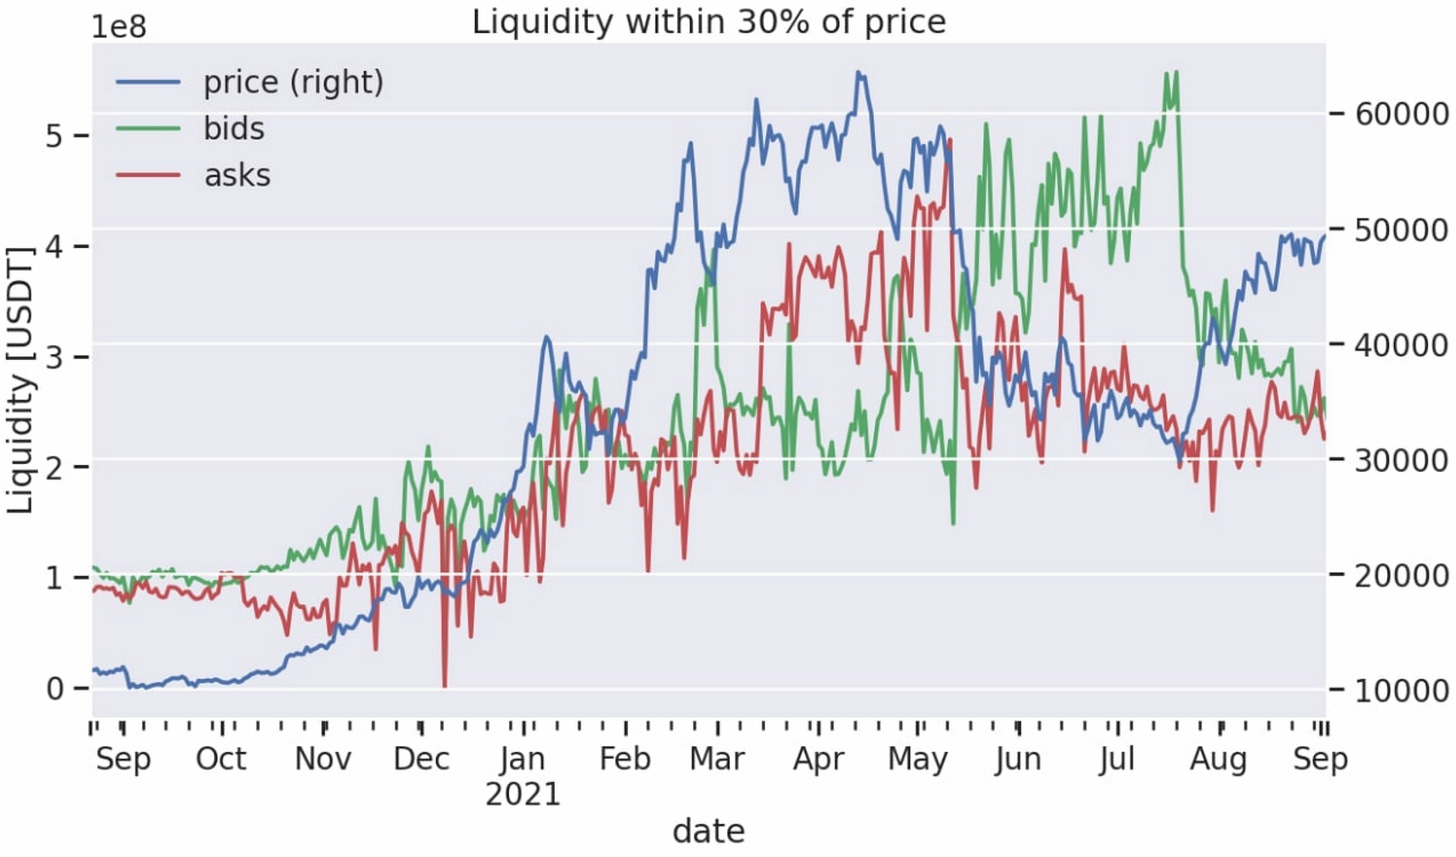
Liquidity was beginning to dry up as well.
To explain this one, let’s look at a chart by our friends from Material Indicators. It shows how much liquidity is within 30% of the current price of bitcoin on any given day.
First, during the February-April rally the bid side (green line) began to run out of steam. And prior to the drop the amount of liquidity on the sell side (red line) of the book outweighed the liquidity on the buy side - meaning more sellers than buyers.
As you can see more recently, the liquidity on the sell side was surpassing the bid side again. Only this time the bid side had dropped significantly.
We can then pair OI, bearish metrics, and liquidity with our friend Pablo who of course needed to make an appearance.
He was one of the bearwhales fighting the bullwhales we spoke about prior. He’s been involved here and there since $42k.
Seeing him rise up again was in part why we mentioned not only to our clients, but to anybody that follows us that now might be a good time to go risk-off and take some profits.
That’s the wallet tracking part of our analysis.
So to sum it up for bitcoin… The technicals, onchain metrics, liquidity, and wallet tracking areas were turning bearish.
Paired up with the NFT market beginning to slump… Bam, the trend reversed.
In fact, even the morning of the drop we witnessed a transaction that tends to take place when a “by the dip” opportunity is likely to happen. This is what I mean when I saw a few odd transactions took place onchain that led us to believe some of this was premeditated.
Needless to say, there were quite a few variables at play that were compounding on one another to lead to a quick reversal.
Looking Ahead
Alright, so now that we have made some sense of the past, what about the future.
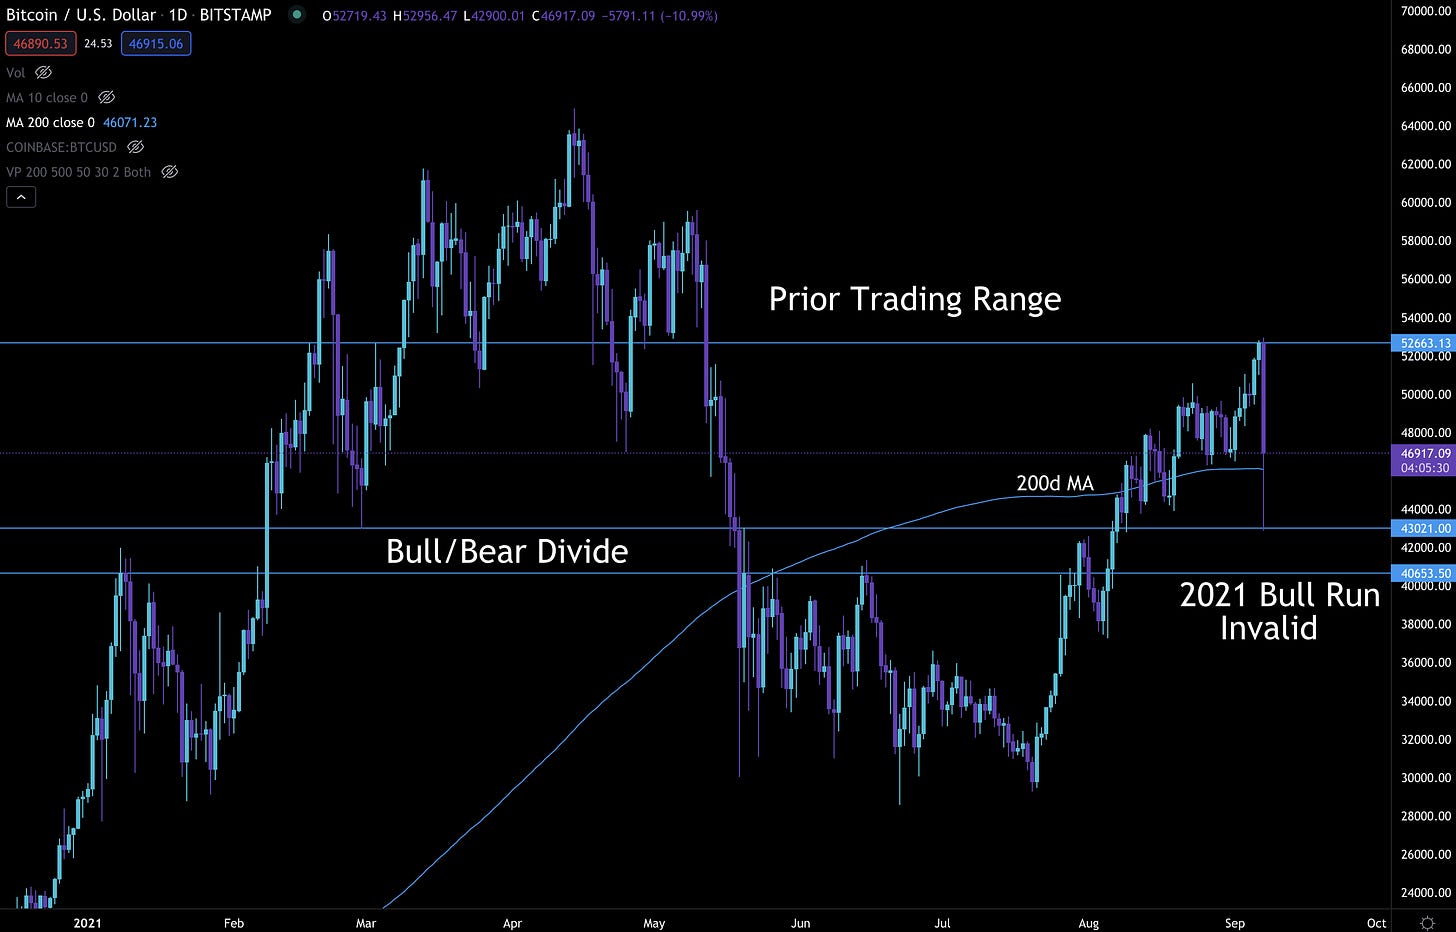
Here’s where we stand on market structure…
If we form a lower low (<$43k) then a late-2021 bull run appears to be a very low possibility. In the chart below this would mean price entering the “Bull/Bear Divide”. With a close below it we are full bear mode.
That’s the technical side of things.
As far as some onchain data I’m pretty interested to see how older holders of bitcoin respond to this price action. The pinkish color below represents coins that have not moved in 1-3 years.
In 2017 there was a major run to the exit as holders viewed the rally as over. For 2013 there were two periods of selling that preceded the biggest moves in price.
So there is no one way to interpret this data. But if we were to see a repeat of 2013 the selling of old coins that preceded the rallies might spell trouble.
If it were to look more like 2017 then we need to see a bigger onchain response before we can say the bull cycle is over.
I actually have a lot more to say on this type of analysis, and it will be the subject of a later piece on HODL waves.
For now, we’re focused on funding rates and liquidity pools. With a quick change in sentiment the market will sometimes prey on overly bearish behavior. Meaning price can quickly squeeze out shorts who entered late.
Once this easy pickings scenario plays out we’ll see how the structure looks. If it’s a big squeeze then maybe we can get another attempt at $53k.
If not… then I’m worried.
Your Pulse on Crypto,
Ben Lilly


Always greatly appreciate your write-ups. They give a sense of direction. I feel like your writing has become more accessible too.
There's a nice bit of short liquidations forming around 47.5k. Seems reasonable that the price will go there next-ish, maybe with a lil push down beforehand.
Ben ... my friend ... I'm so addicted to your thoughts, I can't wait.
They are very inspiring and stimulating for me.
I am from Poland and I edit all your articles myself and forward to the Telegram group to my friends. You are a seed for us, because thanks to you a lot sprouts in us and I hope that we will harves